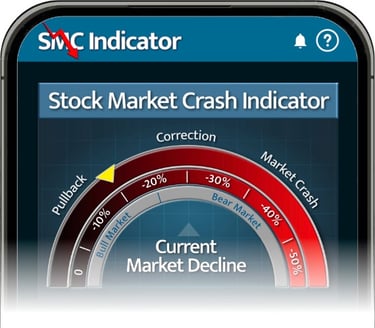
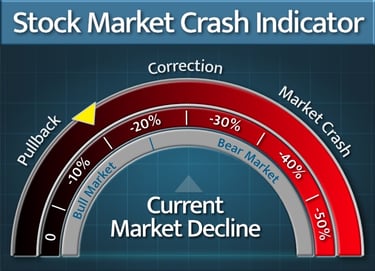
Stock Market Crash Indicator tracks the current rate of stock market decline.
The Stock Market Crash Indicator (SMC Indicator) is an app designed to serve as an early warning indicator for the next major market crash. The SMC Indicator measures the current rate of decline of the total stock market since the last market high. Keep track of the current percentage rate of decline of the entire stock market with the Stock Market Crash Indicator.

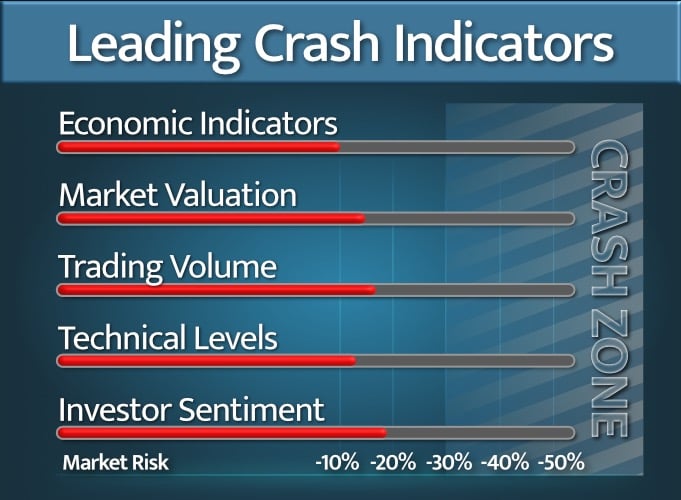
Five Leading Crash Indicators that warn of a major market decline.
The LCI chart (LCI) tracks the top five leading stock market crash indicators. When all five indicators reach the Crash Zone and at least one of them reaches its maximum value, it signals a potential stock market decline of 30-50%, which has occurred 13 times since the Great Depression. Gain valuable insight into the next most likely stock market crash setup with the leading stock market crash indicators.

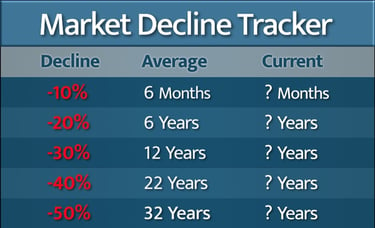
Stock Market Decline Tracker charts historic average vs. current market timelines.
The Market Decline Tracker (MDT) lists the historical average amount of time between certain percentage declines in the total stock market. The MDT also tracks the current amount of time passed since a given percentage decline. Gain valuable insight into when the next level stock market decline is due to repeat.

Stock Market Crash Indicator is available on your favorite app store.
Download the Stock Market Crash Indicator from your favorite App Store today.